Home / Network / Understand how Aruba ARMizes your WLAN for sure!

Understand how Aruba ARMizes your WLAN for sure!

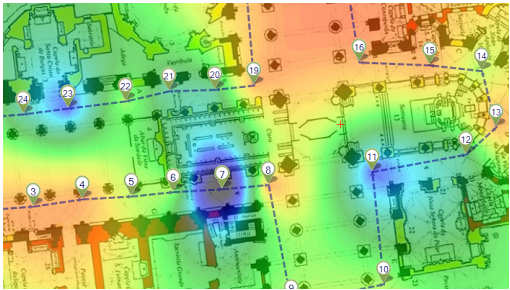
Presenting ARM

In this post, that is a part of a serie of post that discuss how Wlan to radio ressources management, we talk of Aruba way of doing it.

The figure shows a simple wlan network of 6 AP or access points. This is heatmap showing that radio signal is very strong (in red) nearest to the AP and weak too fare from them (in blue).

Aruba’s way of doing radio resource management is called Adaptive Radio Management or ARM and is responsible specifically of transmit power management and planning of radio channels for Wlan (WIFI) access points.

ARM processes and maintains two measures for every channel : a coverage index and an interference index [2] [3].

TPC…

ARM processes the Transmit power control or TPC over a given channel based mainly on the coverage index.

Still that both indexes, coverage and interferance, are processed by the controller (which is a central intelligence equipement physical or logical that associates all the information from all the AP belonging the same domain, process it in order to optimize the indexes for the best overall network operation), in a controller-based architecture also called WLC-based, and matched to access points per channel. The access points are configured automatically by the controller (WLC) to match the already processed radio plan: what channel to use by each AP and at what power… this configuration is consistent because it is handled solely by the controller and also, dynamic because it changes overtime!

Where to get coverage information

This processing (of the coverage) is based on the information reported by access points [1], every 10 seconds and for 110 millisecond scan time duration by default [7].

In addition to this channel scanning, access points exchange proprietary messages, ARM Over The Air Updates [1] [6], on every supported channel. These messages when received by other access points are relayed back to the controller for further processing. These messages are IEEE 802.11 management messages and carry this information:

  1. Channel currently used by reporting access point for wifi clients
  2. Current transmit power EIRP over this channel
  3. A list of detected neighboring access points over this channel

Usage information

Access points report also this information [1] [2] that evaluate the quality of transmission in both control and data plane :

  • % of retransmissions,
  • % of low rate frames,
  • % of non-unicast frames,
  • % of fragmented frames,
  • Channel rate in kbps,
  • % of PHY errors,
  • % of MAC errors,
  • Level of floor noise.

Processing of coverage information

All this information is consolidated at controller level in a table [5] that matches for every access point and per channel the percentage of retransmissions, physical errors, mac errors, noise level and processes an evaluation of these indexes:

  1. util (Qual): that is an indication of the channel quality based on effective usage of it.
  2. cov-idx : coverage index.
  3. intf_idx : interference index.

Power control

The decision of increasing or decreasing the transmit power level on a given channel is based on the processed coverage index as compared to the “ideal” coverage index, noted cov-idxideal, and “acceptable” overage index, cov-idxacceptable, both configured at controller level [4].

As a general rule the current coverage index should be greater than cov-idxacceptable and equivalent to cov-idxideal, [3].

Coverage index, cov-idx, that acts directly on transmission power level on a given channel is a function of detected access points SNR on the same channel as it is measured relatively by each other.

It corresponds to the sum of two variables « x » and « y ». « x » being the weighted average of all other access points SNR as being measured by the current access points. « y » is the weighted average of processed « x » variables by other access points from the same vendor and on the same channel [2].

Example of power processing

As an example let’s consider a set of 3 access points : AP1, AP2, and AP3, that reports respectively these SNR measures : (SNR12, SNR13), (SNR21, SNR23), and (SNR31, SNR32). Then the coverage indexes are written as follows for every access point:

  1. cov-idx(AP1) = x1/y1
  2. cov-idx(AP2) = x2/y2
  3. cov-idx(AP3) = x3/y3

Such as,

  • x1 is a function of SNR21, SNR23, SNR31, SNR32
  • x2 is a function of SNR12, SNR13, SNR31, SNR32
  • x3 is a function of SNR12, SNR13, SNR21, SNR23
  • y1 a function of x2 and x3
  • y2 a function of x1 and x3
  • and y3 a function of x1 and x2

SNRs and EIRPs

SNRs when they are processed at the same time as EIRPs (sent previousely in ARM Over the Air Updates) can help accurate processing of xn and cov-idx(APn). It is to notice that SNR measures are based on received signal and are processed locally whereas EIRP are reported measures at transmission that are sent over ARM management messages to neighboring access points and back to controller for consolidation.

References 

[1] http://fr.slideshare.net/Venudhanraj/3-aruba-arm-and-cm, 2014.
[2] Aruba Network, techdocs, ARM Coverage and Interference Metrics.
[3] Aruba Network, techdocs, ARM Yourself to Increase Enterprise WLAN Data Capacity.
[4] Aruba Network, techdocs,rf arm-profile.
[5] Aruba Network, techdocs,show ap arm rf-summary.
[6] Aruba Network, techdocs,Understanding ARM.
[7] Aruba Network, techdocs,Adaptative Radio Management (ARM)

Leave a Reply

adsense (1) application (2) architecture (4) asm (4) automatisation (2) backbone (1) cef (1) chd (2) cisco (6) cloud (1) command (5) controller (1) cost (6) coverage (2) debug (9) distance (6) fiber (1) gns3 (1) google (1) hpe (1) http (1) igmp (5) igp (8) internet (2) ip (2) label (1) ldp (1) logique (2) loop (5) lsp (1) mac (3) meraki (1) model (2) mpls (3) mroute (4) multicast (5) nat (1) ndp (2) network (3) next-hop (5) osi (5) pat (1) pim (4) poisoning (6) projet (2) qos (1) radio (3) rib (5) rip (5) route (6) router (6) routing (14) rpf (4) rrm (3) security (3) show (5) simulation (2) solution (2) split-horizon (5) sql (1) ssm (4) static (6) stp (2) summarization (5) switching (1) tcp/ip (1) telecom (1) template (1) traffic engineering (1) translation (1) travail (2) vpn (2) vrf (3) wifi (4) wlan (2)

  • What is the best way of subnetting?
    In this post, let’s recall what is subnetting (for routing and switching purposes) and how it is done. introduction and motivation Network subnetting is very important subject that maybe referred to as VLSM for variable length subnetting. The basic idea is about managing a space of IP addresses (IPv4). Historically, a network length or space
  • SSL VPN to my home network
    In this blog let’s try to connect to a home network from outside (internet) in a secure manner using SSL. NAT and PAT NAT and PAT is what allowed local IP addresses translation or mapping to some routable public IP address (over the internet). This mapping can be one to one (NAT) or many to
  • Routing from scratch… Part 1
    In this serie of posts we’ll explore routing operation. Let’s start from the general idea of how could we manage trafic, a move from one location to another… In the example of the figure presented next, the person in A wants to join its colleagues in location B through the network topology described in the
  • When a gateway says: “I’am not a good gateway… set redirection!”
    In this blog we explore how a gateway (a router) present in a LAN handles routing to the outside of this network and use redirection to enhance this operation. lab setup Our lab setup is 3 routers: R1, R2 and R3, in addition to 2 PC: PC1 and PC2. In this lab, PC1 tries to
  • Multicast: rather than dense, sparse it and let’s meet at rendez-vous point… Part 5
    in this post let’s detail the operation of PIM (Protocol Independent Multicast) in sparse mode. Previous posts tackled the operation of PIM dense mode. Let’s recall that PIM is the multicast routing protocol that allows PIM routers exchange information needed distribute multicast traffic to receivers. lab setup In our setup, Client1 is configured to join
September 2025
M T W T F S S
1234567
891011121314
15161718192021
22232425262728
2930  
Table of Contents
Copied!